
California Work Opportunity and Responsibility to Kids (CalWORKs), California’s version of the federal Temporary Assistance for Needy Families (TANF) program, provides cash assistance to low-income families with children. CalWORKs provides parents with cash assistance for expenses such as food, housing, utilities, or medical care, and may be particularly helpful for parenting college students, who temporarily forgo earnings to invest in their education.
In the 2022–23 academic year, 57,400 California Community College (CCC) students and 1,200 University of California (UC) students either received CalWORKs benefits or had a household member who received benefits. Student participants received an average of $256 per person, per month.
This data point presents student participation rates in CalWORKs, which we define as either appearing on a CalWORKs case themselves, or living in the same household as someone who appears on a CalWORKs case (e.g., a college student whose child participates in CalWORKs). We visually differentiate these two categories in the figures.
Key Findings
1. In Academic Year (AY) 2022–23, CCC and UC CalWORKs participants received an average of $256 per person, per month. Per-person monthly payments peaked at $315 in AY 2021–22, during the pandemic, after steady increases since AY 2011–12.
Average CalWORKs per capita monthly benefits for UC and CCC students, 2011–12 through 2022–23
2. CalWORKs participation was highest among CCC students in the Central Valley (5.3% of all enrolled students), followed by the Inland Empire (3.7% of students), and San Diego (3.3% of students).
CalWORKs participation rates by CCC region, 2022-23
3. CalWORKs participation was more common at UC Merced than other UC campuses, with 1.2% of students participating (combining undergraduates and graduate students), followed by UC Riverside (0.6%) and UC Santa Cruz (0.5%)
CalWORKs participation rates by UC campus, 2022-23
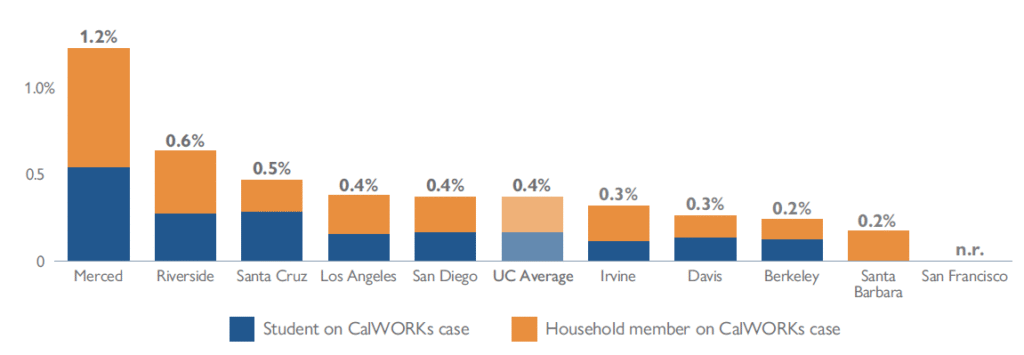
Source: Data for this figure was provided to CPL by the California Department of Social Services and the University of California Office of the President. Note: This graph combines UC undergraduates and graduate students due to small cell sizes. N.r. indicates that very few students at UC San Francisco or their household members participate in CalWORKs, and very few students at UC Santa Barbara are on a CalWORKs case. Specific values are suppressed to protect student privacy.
4. CCC students in their 30s had the highest participation rates, while participation rates were lowest among traditional aged college students (18-21).
CCC CalWORKs participation rates by age groups, 2022-23
5. At the UCs, participation was highest among students under 18 years old. Students under 18 (including dual enrollment students) are largely benefiting from CalWORKs as children, not as parenting students.
UC CalWORKs participation rates by age groups, 2022-23
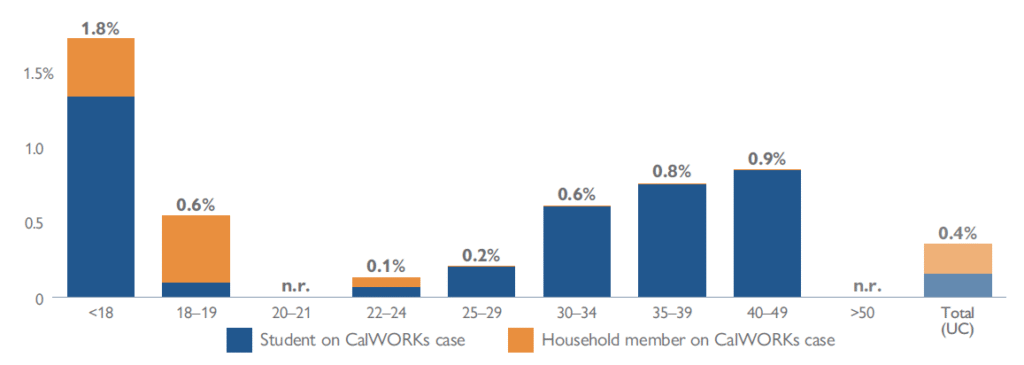
Source: Data for Figure 8 was provided to CPL by the California Department of Social Services and the University of California Office of the President. Note: This graph combines UC undergraduates and graduate students due to small cell sizes. N.r. indicates that very few students in these age groups at the UCs participate in CalWORKs. Specific values are suppressed to protect student privacy.
Suggested citation: Tan, C., Hogg, J., Lacoe, J., Rothstein, (2025). CalWORKs Participation Among California’s College Students. California Policy Lab, University of California. https://capolicylab.org/calworks-participation-among-californias-college-students/