- By:
- Category: Labor

REPORT: Unemployment Insurance Claims After the LA Wildfires ![]()
PRESS RELEASE: New Report Estimates 11,000 Workers Filed for Unemployment Insurance Because of LA Wildfires
Select Media Coverage
Joblessness jumped in LA County after January’s fires, new report finds (LAist, August 25, 2025)
Los Angeles area unemployment claims surged following January wildfires: Report (The Hill, August 25, 2025)
More than 11,000 workers filed for unemployment assistance programs because of Los Angeles wildfires, new report shows (UCLA Newsroom, August 25, 2025)
Overview
The 2025 Palisades and Eaton wildfires in Los Angeles County destroyed over 13,000 homes and nearly 2,000 business establishments, displacing thousands of residents and workers. This report shows the impact the fires had on workers and local economies and highlights key insights for policymakers responding to natural disasters.
In the weeks following the fires, 6,300–8,700 more new regular Unemployment Insurance (UI) claims were filed than would be expected without the fires, a 12–17% increase. An additional 5,000 workers filed claims through the federal Disaster Unemployment Assistance Program.
This research is produced through a partnership between the Labor Market Information Division of the California Employment Development Department and the California Policy Lab.
Key Findings
1. An additional 6,300 to 8,700 workers filed regular unemployment insurance (UI) claims in Los Angeles County due to the wildfires. New claims for regular UI increased from about 5,000 in the week before the fire to about 12,000 in the first week after the fire, and remained elevated for several weeks.
FIGURE: New UI claims in Los Angeles County in 2025 compared to Baseline 1: Los Angeles County in 2024
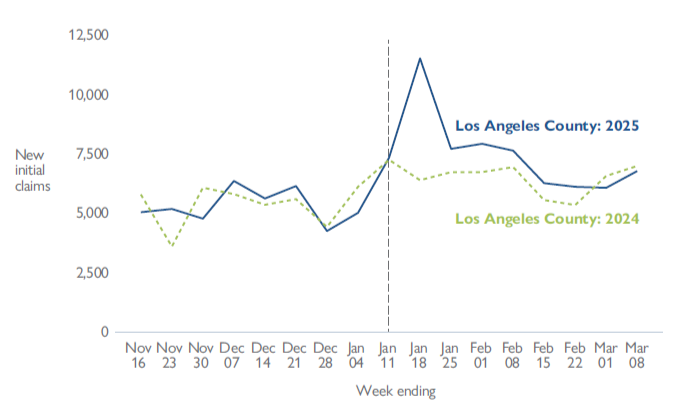
Source: CPL calculations using EDD administrative data. The black dotted line represents the beginning of the wildfires.
2. Between 30% and 40% of workers whose jobs were potentially impacted by the fires filed UI claims.
TABLE: Number of new UI claims attributable to the fires, and number of jobs potentially impacted by the fires
3. The impacts of the fires on workers extended well beyond the physical boundaries of fire damage and included workers who likely commuted to these regions. While the increase in UI claims was highest in fire-affected ZIP codes, significant claim increases also occurred in Central and South LA — areas untouched by the fires. ZIP codes with a higher share of commuters to fire-affected regions had larger increases in UI claims.
FIGURE: Percent change in new initial claims from Nov-Dec 2024 to Jan-Feb 2025 by ZIP
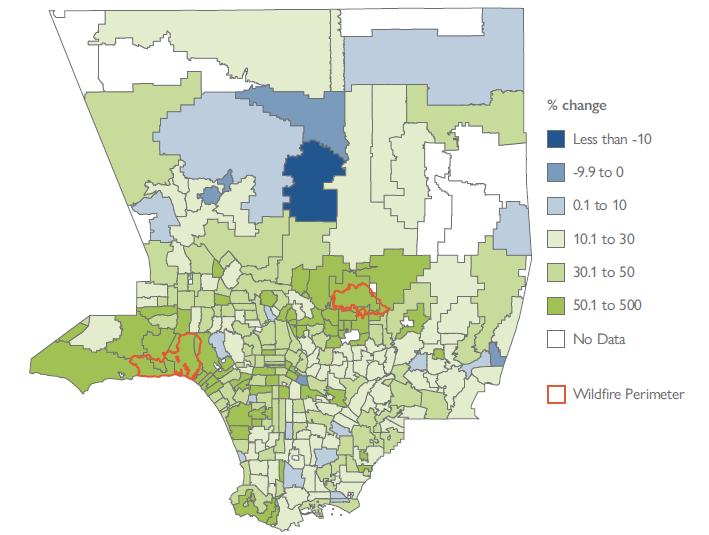
Source: CPL calculations using EDD administrative data. Percent change was calculated by adding UI claims across November & December 2024 and January and February 2025 and taking the percent difference between them.
4. Increases in UI claims across industries and demographic groups reveal the uneven economic impacts of the wildfires across both sectors and populations. Workers in the Accommodation & Food Services industry were the most impacted, reflected in a sharp, initial spike in UI claims after the fires. Workers in the Healthcare and Social Assistance sector were also impacted, with a pronounced spike in UI claims immediately following the fires. Additionally, the increase in UI claims for workers with a high school degree or less was over 50% larger than for workers with a bachelor’s degree.
FIGURE: Percent change in new UI claims by industry before and after fires across LA County, nearby counties, and further counties, Nov 16, 2024 – March 8, 2025
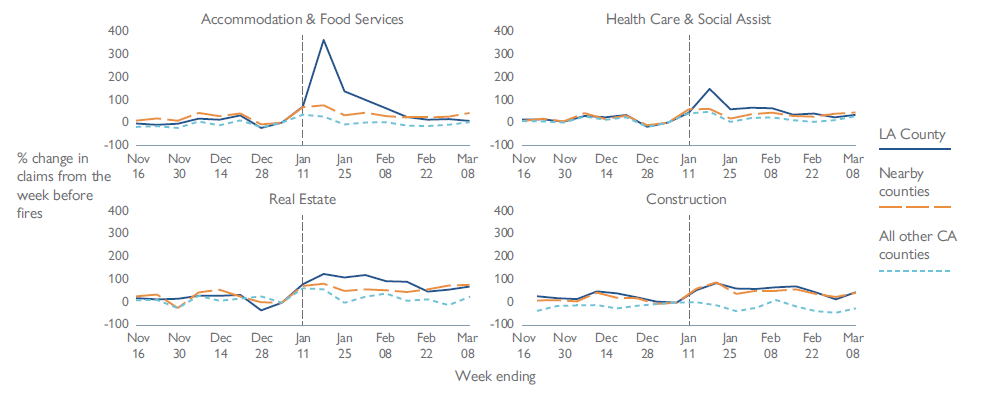
Source: CPL calculations of EDD administrative data. Claims for each region are normalized so that the week before the fires represents 0 and all other weeks represent percent increases or decreases relative to that week. The “Nearby” counties consist of Orange, Santa Barbara, San Diego, Riverside, and Kern, and the
“Further” consist of the rest of the CA counties except for Ventura and San Bernardino (because they were also affected by the wildfires). The dotted vertical line represents the start of the fires.
5. Over 5,200 workers who were otherwise ineligible for UI claimed Disaster Unemployment Assistance benefits after the fires. The Disaster Unemployment Assistance (DUA) program began processing applications on January 25th and supported workers who would not normally be eligible for regular UI, such as independent contractors, gig workers, and the self-employed.
Figure: Total number of DUA claims filed by workers living in fire-impacted areas and non-impacted areas, Jan 2025-March 2025
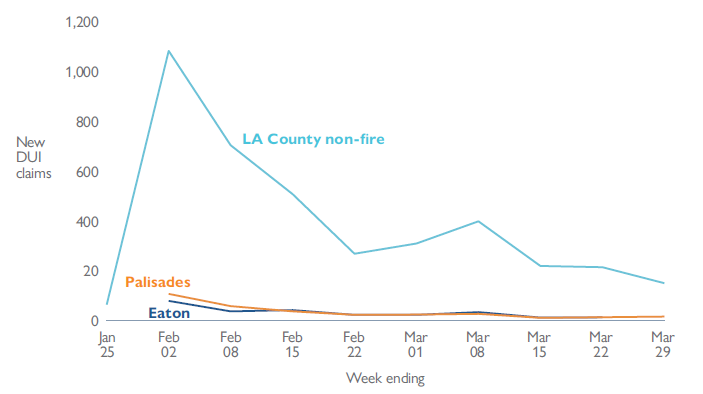
Source: CPL calculations of EDD administrative data. The Eaton and Palisades fire regions are defined by the blue and green colored ZIP codes from Figure 1. The Non-fire region is the rest of Los Angeles.
Suggested Citation: Lapinski, P., Mannino, P., Moghadam, R., Morris, J. Von Wachter, T. Unemployment Insurance Claims After the LA Wildfires. California Policy Lab. (2025). https://capolicylab.org/unemployment-insurance-claims-after-the-la-wildfires/