
Tracking AI-Related Job Loss Using Unemployment Insurance Claims Data in California
The California Employment Development Department partnered with the nonpartisan California Policy Lab at the University of California to conduct research to measure AI-related job loss trends in California, using Unemployment Insurance claims data, combined with AI exposure measures. The California Policy Lab developed the California AI-Unemployment Tracker (CAIT), which will be updated monthly. The underlying data are available for public use (see download link under the tracker). See the associated report for more information: “Tracking AI-Related Job Loss Using Unemployment Insurance Claims Data in California”
Download the data in Excel (ADA compliant)
Key Findings from June 2026 Release
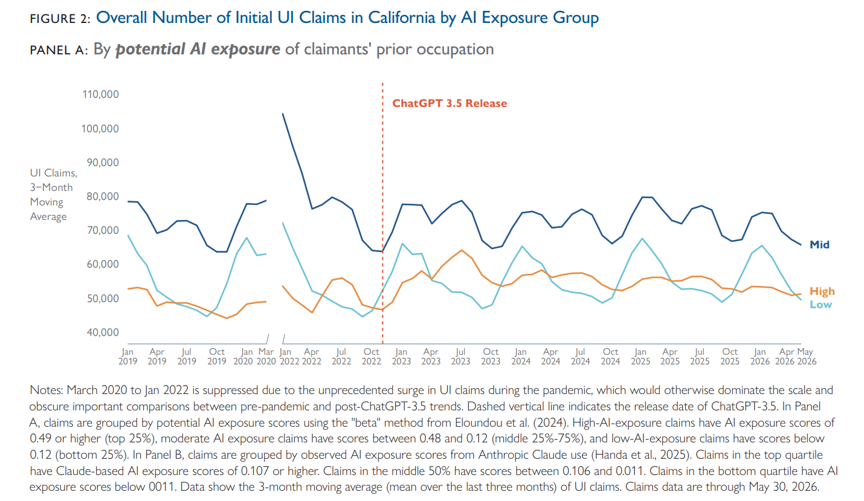
Since the release of ChatGPT-3.5 in 2022, statewide UI claims through May 2026 show no evidence of a surge in AI-related layoffs. The proportion of UI claims coming from AI-exposed workers has also not seen a statistically significant increase relative to prior to the pandemic. This is consistent with existing Current Population Survey estimates that show no nationwide link between AI exposure and unemployment.
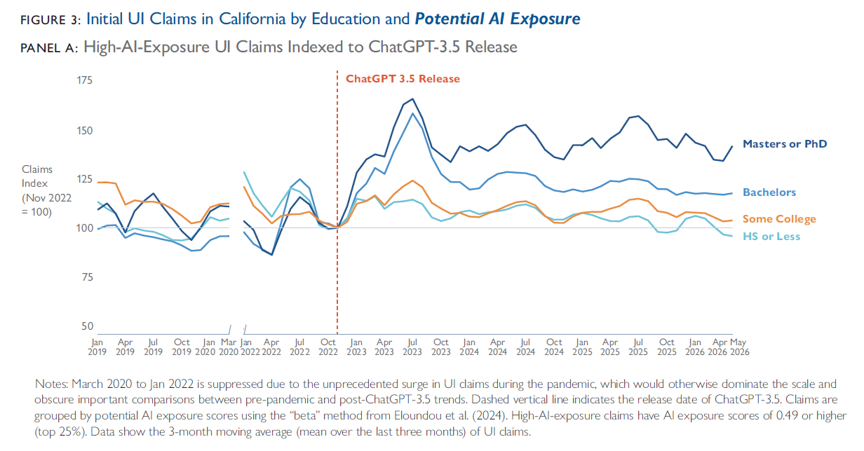
While AI-related job loss is not detected across all UI claims statewide, claims from college-educated workers in occupations with high AI exposure increased after ChatGPT-3.5’s release in 2022, and remained elevated through May 2026, compared to low-AI-exposure workers who did not experience a noticeable change in trend, relative to their pre-pandemic level in 2019 and early 2020.
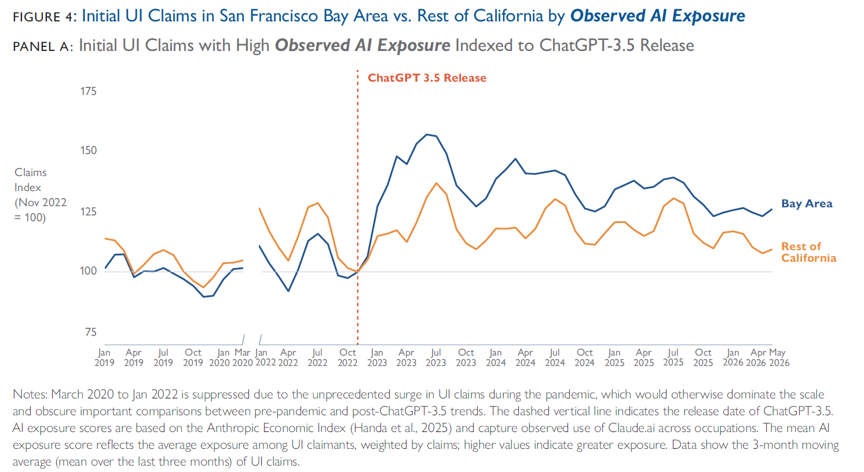
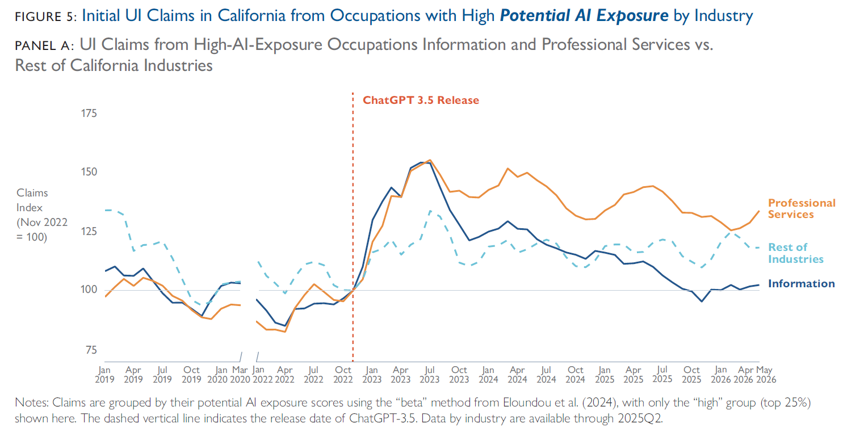
Over this same period, claims from workers in occupations with high AI exposure in the San Francisco Bay Area also experienced a sharp and sustained increase. AI-exposed UI claims were also particularly elevated statewide in technology sectors such as Information and Professional Services over the same period. Claims levels from many of these subgroups remained elevated in 2025 and through May 2026, even relative to their pre-pandemic level in 2019 and early 2020.
About the California AI-Unemployment Tracker (CAIT)
The California AI-Unemployment Tracker (‘CAIT’ or “The Tracker’) provides early signs of possible AI-induced job loss. It shows the number and share of Unemployment Insurance claims over time in California, categorized by how exposed to AI the person’s most recent job was (AI Exposure measure). For each unemployment insurance customer (also called claimants), the tracker additionally shows trends by age, education, gender, industry, race and ethnicity, and region, as well as the average AI exposure score by each group.
The tracker was created through a partnership with the California Policy Lab (CPL), a nonpartisan research center at the University of California. The data is updated monthly and analyzed to identify key findings. Its underlying tabulated data is available for public use. See below for definitions of terms used in the dashboard, its methodology, data source, and more.
Definition of terms
Initial Claims
The count of initial Unemployment Insurance claims filed by customers for each calendar month. Initial claims include both new claims (those applying for the first time) and additional claims, which occur when a customer returns to work, skips at least one certification week, and then reopens a prior claim before the benefit year expires. Each claim is dated to the month of its week-ending date.
Categorical AI Exposure Measures
The tracker uses two measures of AI exposure – Potential AI Exposure and Observed AI Exposure. Potential Exposure assesses whether large language models are capable of reducing the time required to complete an occupation’s tasks by at least 50%. Observed AI Exposure captures the extent to which an occupation’s tasks are performed using Anthropic’s Claude platform, based on observed Claude usage. More details about these measures are below.
Mean AI Exposure Score: The mean AI exposure score reflects how exposed to AI, on average, the customer’s job was.
Age: The customer’s age band at the time they applied. Customers aged 16-25 and 66 and older are not shown on the chart because the small sample sizes make the data very noisy. However, these age groups are available in the downloadable excel file.
Education: The customer’s highest level of educational attainment, as reported at the time of filing.
Gender: The customer’s gender, as reported at the time of filing.
Industry: The 2-digit North American Industry Classification System (NAICS) sector of the customer’s most recent employer. Industry is assigned based on information reported by the employer and may be unknown for some customers.
Race and Ethnicity: The customer’s race and ethnicity.
Region: The region corresponds to the customer’s residence at the time of applying, regardless of where they were employed. California is divided into 14 regional planning units (RPUs).
How Are These Data Developed? (Methodology)
This methodology, developed by CPL, involves linking California unemployment claims records to established measures of occupational AI exposure to track potential AI-related job loss over time.
Data
The data underlying the tracker are drawn from unemployment administrative records maintained by the EDD. These records are compiled as part of the operation of the program and cover workers who apply for benefits after a layoff from a covered California employer.
Initial unemployment claim data reflect eligible workers who were laid off through no fault of their own, had sufficient prior earnings to qualify, and subsequently applied for benefits. Initial claims include both new claims (applied for the first time) and additional claims (when a customer returns to work, skips at least one certification week, and then reopens a prior claim before the benefit year expires). Each claim is dated to the month of its week-ending date.
When applying for benefits, customers self-report their occupation from a standardized list. The tracker uses this occupation information to assign each customer to an AI exposure score based on their pre-layoff job. The data also include characteristics reported at the time of filing, including county of residence, industry of most recent employer (classified by the North American Industry Classification System, NAICS), age, gender, race and ethnicity, and educational attainment.
AI Exposure Measures
Each customer is assigned an AI exposure score based on the occupation they reported at the time of applying.
The Tracker uses two complementary measures of AI exposure:
- Potential AI Exposure. This measure assesses whether LLMs are capable of reducing the time required to accomplish an occupation’s tasks by at least 50%. This approach was developed by a team of OpenAI and academic researchers (Eloundou et al., 2024) and is widely used by AI researchers and considered an industry standard.
- Observed AI Exposure. This measure assesses how often workers use Anthropic’s Claude platform to complete occupational tasks. The measure was developed as part of the Anthropic Economic Index (Handa et al., 2025), is intended to capture actual or observed AI use among Claude users and can be updated as the capabilities of Claude evolve.
Both measures are used together to build a more complete picture of AI exposure across the customer population. Results are largely consistent across both measures.
AI Exposure Groups
Each customer is assigned to one of three AI exposure groups based on the score for their reported occupation:
● High AI Exposure: Top 25% of scores (potential measure: ≥ 0.49; observed measure: ≥ 0.107). Includes occupations most susceptible to AI-related disruption, such as customer service representatives and software developers.
● Moderate AI Exposure: Middle 25%–75% of scores (potential: 0.12-0.48; observed: 0.011–0.106).
● Low AI Exposure: Bottom 25% of scores (potential: < 0.12; observed: < 0.011). Includes occupations that are less susceptible to AI, such as heavy truck drivers or nursing assistants.
Context for Using These Data
● AI exposure measures used in this tracker, including Anthropic’s Claude-based observed exposure measure, capture the extent to which job tasks could be or have been performed by AI, not whether AI was the cause of any specific layoff. The Tracker should be interpreted as a descriptive signal, not causal evidence, of AI-driven job loss.
● UI claims do not capture workers who do not file for UI, either because they are unaware of it, because they quickly find new employment, they exit the labor force altogether, or they are not eligible for UI due to their legal status, or because they are self-employed (including gig workers), or in the case of younger workers, because they haven’t worked long enough or with sufficient earnings to qualify for UI benefits.
● Occupation codes are self-reported by customers at the time of filing and are not verified. In a small minority of cases, occupation codes are missing and not included in these data.
● In accordance with California UI program confidentiality requirements, data for cells with very few claims are suppressed. As a result, some rows may be missing from the data download.
● UI claims data are updated over time. Subsequent monthly updates of this tracker may revise counts for previously reported months as late and amended claims are processed.
● Administrative data such as these are sometimes revised; figures should be treated as preliminary until finalized.
● The pandemic-era surge in UI claims (March 2020 through January 2022) is excluded from trend figures due to its outsized scale, which would otherwise obscure pre-pandemic and post-ChatGPT-3.5 comparisons.
Full methodological details, robustness checks, and alternative AI exposure specifications are available in the associated technical appendix Technical Appendix: Tracking AI-Related Job Loss Using Unemployment Insurance Claims Data in California.
About This Research: CPL and EDD Partnership
This research is produced through a partnership between the Labor Market Information Division of the EDD and the California Policy Lab (CPL), a nonpartisan research center at the University of California, with sites in Berkeley, Los Angeles, and Sacramento.
Under this partnership, CPL accesses tabulations from EDD unemployment administrative data in accordance with an agreement governing permitted uses, privacy, and confidentiality requirements. CPL is committed to responsible data stewardship, including practices that secure data and protect privacy while enabling rigorous, policy-relevant research.
The findings from research reports created by CPL do not necessarily reflect the views of the Labor Market Information Division of the California Employment Development Department. The calculations were performed solely by the California Policy Lab. Any errors or omissions are the responsibility of the California Policy Lab, not of the Labor Market Information Division at the EDD.
For questions about the definitions, methodology, and findings of this tracker contact Dr. Ben Hyman or Professor Till von Wachter from the CPL.
For questions about the data underlying the tabulations in this tracker contact Juan Barrios, Chief of the Labor Market Information Division at EDD.
Data Sources and Additional Resources:
California EDD Unemployment Insurance Claims Records, January 2017 to Present
Eloundou, T., Manning, S., Mishkin, P., & Rock, D. (2024). GPTs Are GPTs: Labor Market Impact Potential of LLMs. Science, 384(6702), 1306–1308.
Handa, K., Tamkin, A., McCain, M., et al. (2025). Which Economic Tasks Are Performed with AI? Evidence from Millions of Claude Conversations. arXiv:2503.04761
Frequently Asked Questions
Our FAQs answer many common questions about the tracker and report.
Contact Information
For inquiries about the definitions, methodology, and findings of the tracker, report, or technical appendix, please contact reach out to Dr. Ben Hyman or Professor Till von Wachter.
To obtain further information about the data underlying the tabulations in the tracker, report, or technical appendix, please contact: Juan Barrios, Chief, Labor Market Information Division, California Employment Development Department.
Suggested citation: Hyman, B., von Wachter, T., Herrera, D., Moghadam, R., Morris J., Motghare, S., Segal, K., Chengappa, N. (2026). Tracking AI-Related Job Loss Using Unemployment Insurance Claims Data in California. California Policy Lab, University of California. https://capolicylab.org/wp-content/uploads/2026/06/Tracking-AI-Related-Job-LossUsing-Unemployment-Insurance-Claims-Data-in-California.pdf